The reliability of the individual components inside a node and rack contribute to the overall reliability of a supercomputer. The mathematics of how component reliability affects system reliability is documented in MTBF.
In practice
Meta
Meta published reliability information from their 16K GPU training run of Llama-3.1 405b. 466 interrupts occurred over the 54-day training run, resulting in a 90% job uptime.
Of those 466, 47 were planned activities (hardware/firmware updates or changes to training). 419 were unplanned and broken down as follows:1
| Component | Category | Interruption Count | % of Interruptions |
|---|---|---|---|
| Faulty GPU | GPU | 148 | 30.1% |
| GPU HBM3 Memory | GPU | 72 | 17.2% |
| Software Bug | Dependency | 54 | 12.9% |
| Network Switch/Cable | Network | 35 | 8.4% |
| Host Maintenance | Unplanned Maintenance | 32 | 7.6% |
| GPU SRAM Memory | GPU | 19 | 4.5% |
| GPU System Processor | GPU | 17 | 4.1% |
| NIC | Host | 7 | 1.7% |
| NCCL Watchdog Timeouts | Unknown | 7 | 1.7% |
| Silent Data Corruption | GPU | 6 | 1.4% |
| GPU Thermal Interface + Sensor | GPU | 6 | 1.4% |
| SSD | Host | 3 | 0.7% |
| Power Supply | Host | 3 | 0.7% |
| Server Chassis | Host | 2 | 0.5% |
| IO Expansion Board | Host | 2 | 0.5% |
| Dependency | Dependency | 2 | 0.5% |
| CPU | Host | 2 | 0.5% |
| System Memory | Host | 2 | 0.5% |
The specific issue of silent data corruption is also discussed in LLM training at scale.
Crusoe
Crusoe shared the following failure rates for an H200 cluster at GTC25:2
| Fault Cause | % of cases |
|---|---|
| GPU recoverable faults | 19.5% |
| GPU host replacement | 41.5% |
| Other host issues (CPU, memory, etc) | 4.9% |
| InfiniBand recoverable faults | 4.9% |
| InfiniBand hardware issues | 12.2% |
| InfiniBand other issues | 17% |
The lowest common denominator of the above data suggests they represent 205 observed failures during the four-month period. The talk also discussed a 1,600-GPU H200 cluster in Iceland which may be where this data originated.
NVIDIA
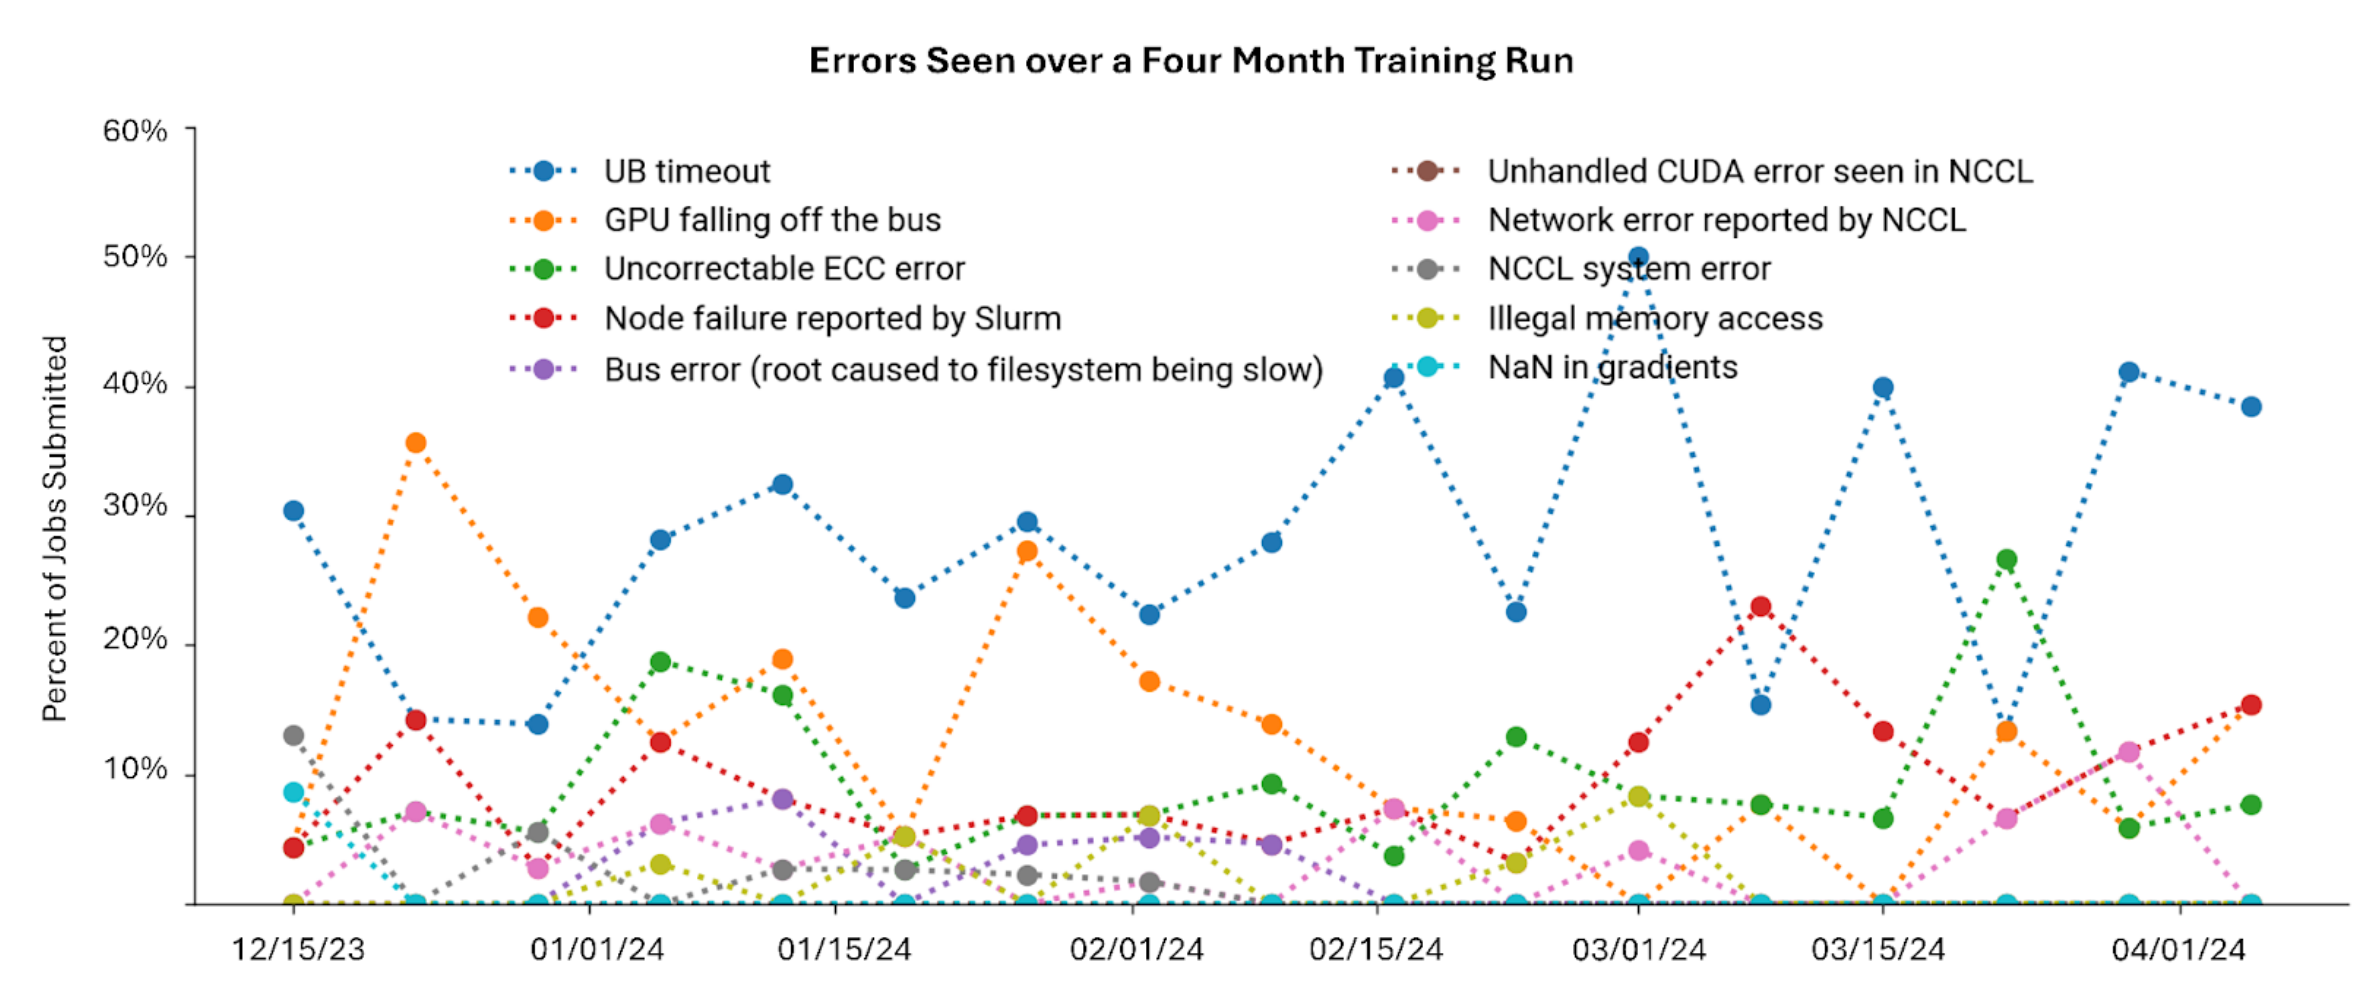
NVIDIA shared the failure frequency for a 6K-GPU training run that spanned a four-month training campaign:3

“UB timeout” is the most frequent root-cause, but NVIDIA doesn’t define it. It may refer to the “intranode user buffer”4 which implies a PCIe error. Similarly, “NaN in gradients” is a symptom, not a cause, but likely is a euphemism for silent data corruption.
Footnotes
-
Fault-Tolerant Managed Training: Crusoe Cloud’s Blueprint for AI Reliability (Presented by Crusoe.ai) | GTC 25 2025 | NVIDIA On-Demand ↩
-
Ensuring Reliable Model Training on NVIDIA DGX Cloud | NVIDIA Technical Blog ↩
-
New Scaling Algorithm and Initialization with NVIDIA Collective Communications Library 2.23 | NVIDIA Technical Blog ↩